The Air Quality Index (AQI) in Southern California frequently fluctuates between 0 and 500, with levels above 150 posing severe risks to respiratory health during physical exertion. Despite these measurable hazards, hikers often struggle to interpret how localized topography and wind vectors transform a general wildfire smoke map los angeles into a reliable safety tool.
This article provides a technical framework for analyzing real-time smoke plumes and atmospheric data to mitigate physiological exposure on the trail. We will examine how to synchronize satellite imagery with topographic analysis to ensure informed decision-making before your next ascent.
- Wildfire Smoke Map Los Angeles: Real-Time Data Interpretation
- Topographic and Meteorological Influences on Trail Safety
- Physiological Risks and Exposure Mitigation Strategies
- Decision-Making Framework for Los Angeles Hikers
Wildfire Smoke Map Los Angeles: Real-Time Data Interpretation
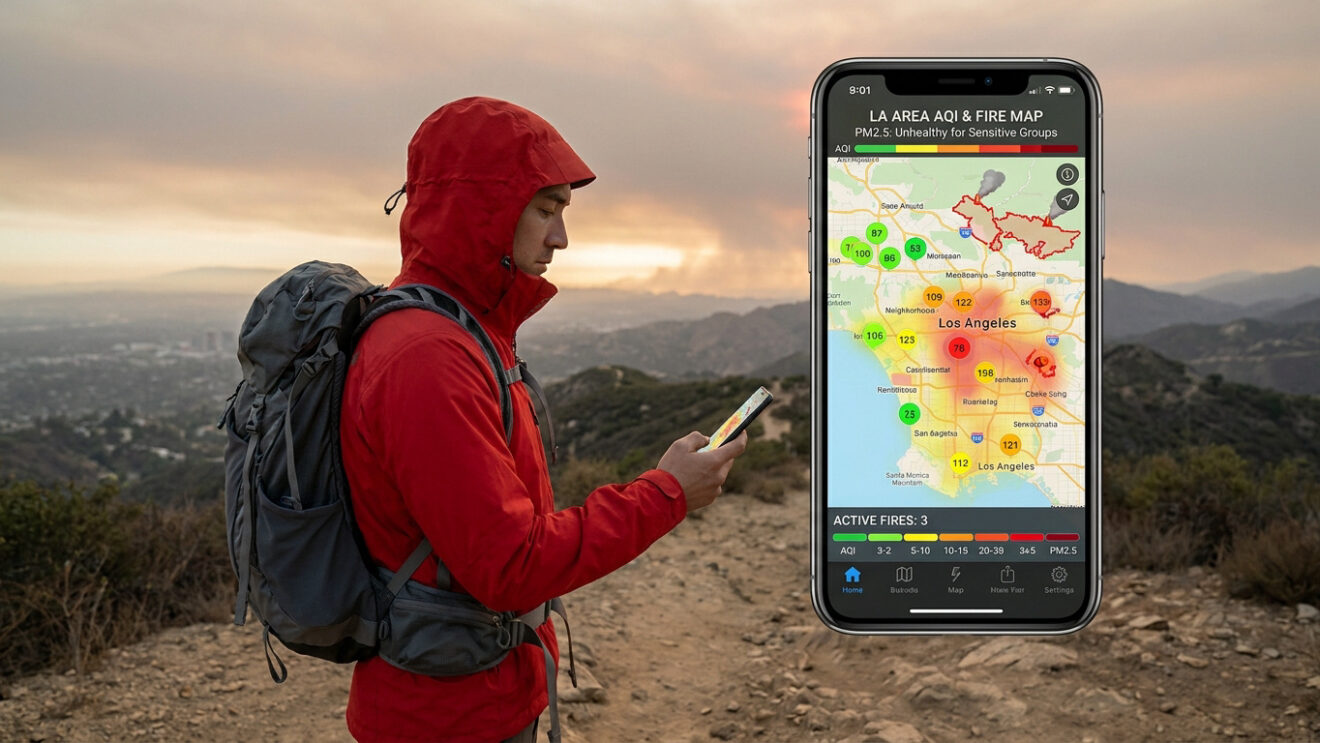
Los Angeles wildfire safety relies on real-time AQI tracking and satellite smoke plume monitoring. Key tools include AirNow for localized PM2.5 levels and CalFire maps for active perimeter updates, essential for interpreting color-coded health risks.
Decoding the Air Quality Index (AQI) Color Scale
The AQI scale ranges from 0 to 500 to measure pollution severity. A rating of 0-50 is considered Good for outdoor activities. Values exceeding 150 trigger serious health warnings for all hikers.
Orange codes indicate air is unhealthy for sensitive groups, while Red signifies unhealthy conditions for everyone. These levels cause throat irritation and significantly reduced lung capacity. Hikers must monitor these specific thresholds to avoid respiratory distress.
Regional averages often mask dangers. Local sensors at specific trail-heads frequently report higher pollution levels than general city-wide data.
0-50: Good/Safe; 51-100: Moderate; 101-150: Unhealthy for Sensitive Groups; 151-200: Unhealthy; 201-300: Very Unhealthy; 301+: Hazardous.
Identifying Active Fire Perimeters and Smoke Plumes
Fire perimeters mark the boundary of active flames and heat. Drifting plumes consist of moving smoke particles. These plumes often travel many miles away from the original fire source.
Satellite imagery helps hikers distinguish between a light haze and dense smoke concentrations. Understanding how to use a wildfire smoke map for safe hiking requires identifying these visual cues accurately before hitting the trail.
- Satellite refresh rates
- Haze vs Smoke visual cues
- Active fire icons
Perimeters = active flames/heat source; Plumes = drifting smoke particles (PM2.5) that can travel hundreds of miles.
Always verify the data refresh frequency. Most Los Angeles mapping sources update every 15 to 30 minutes.
Topographic and Meteorological Influences on Trail Safety
While map data provides a baseline, the complex terrain of Southern California dictates how that smoke actually behaves on the ground.
Smoke Entrapment in Canyons and Valleys
Los Angeles geography creates natural traps. Wildfire smoke frequently settles in low-lying canyons during active burns. Data indicates that Valleys & Foothills often retain pollutants significantly longer than exposed ridges.
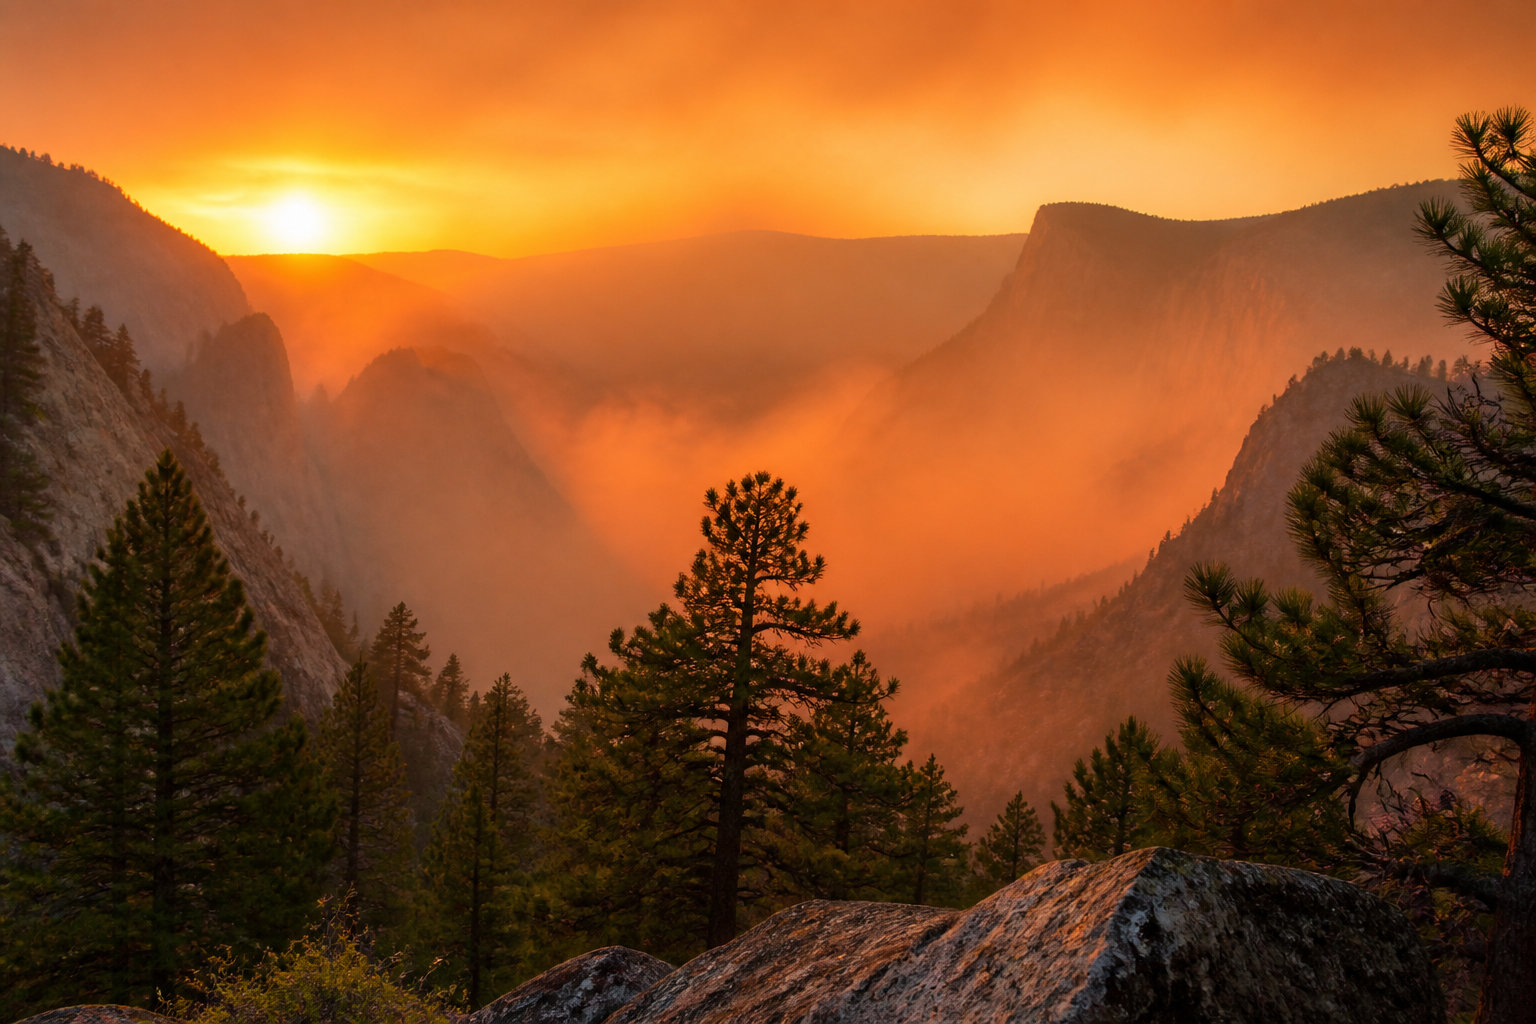
Thermal inversion acts as a physical lid. Cold air layers trap heavy smoke near the ground during early morning hours. This process creates dangerous micro-climates where trail air quality is far worse than the open city center.
Smoke settles in low-lying canyons like Eaton and Runyon due to thermal inversion, making air quality significantly worse than city averages.
Specific high-risk areas require constant monitoring. Canyons like Eaton or Runyon can hold dense smoke even when coastal areas remain clear and breathable for hikers.
Wind Direction Analysis for Predictive Movement
Effective navigation requires interpreting wind vectors. Use directional arrows on maps to forecast smoke drift. You must anticipate shifts in trail conditions before starting your ascent to avoid sudden exposure.
Onshore flows typically push coastal smoke inland toward the mountain ranges.
“Understanding wind patterns is the difference between a clear sunset hike and a dangerous lung-burning climb in heavy particulate matter.”
Santa Ana winds can further accelerate this movement through narrow corridors.
Always utilize real-time sensor data. Check local weather stations for sudden gusts that abruptly change smoke paths during your trek.
Physiological Risks and Exposure Mitigation Strategies
Understanding the environment is only half the battle; you must also recognize how your body reacts to these invisible particulates.
PM2.5 Concentrations and Physical Exertion Dynamics
Respiration rates increase significantly during physical effort. Heavy breathing during steep climbs facilitates deep lung penetration. Fine particulates (PM2.5) enter the bloodstream through the lungs.
Smoke forces the heart to work harder during exertion. This is especially dangerous on popular routes like the Griffith Park trails. High density triggers acute cardiovascular stress.
Lower your pace or choose flat terrain when particulate density rises. Reducing volume helps mitigate cumulative risks.
Children, elderly, pregnant women, and people with heart/lung diseases or diabetes should limit activity when AQI exceeds 100.
Protective Gear and Hydration Requirements
Standard surgical masks do not filter PM2.5 effectively. A tight seal is required to protect your respiratory system. N95 respirators offer the necessary filtration for fine ash.
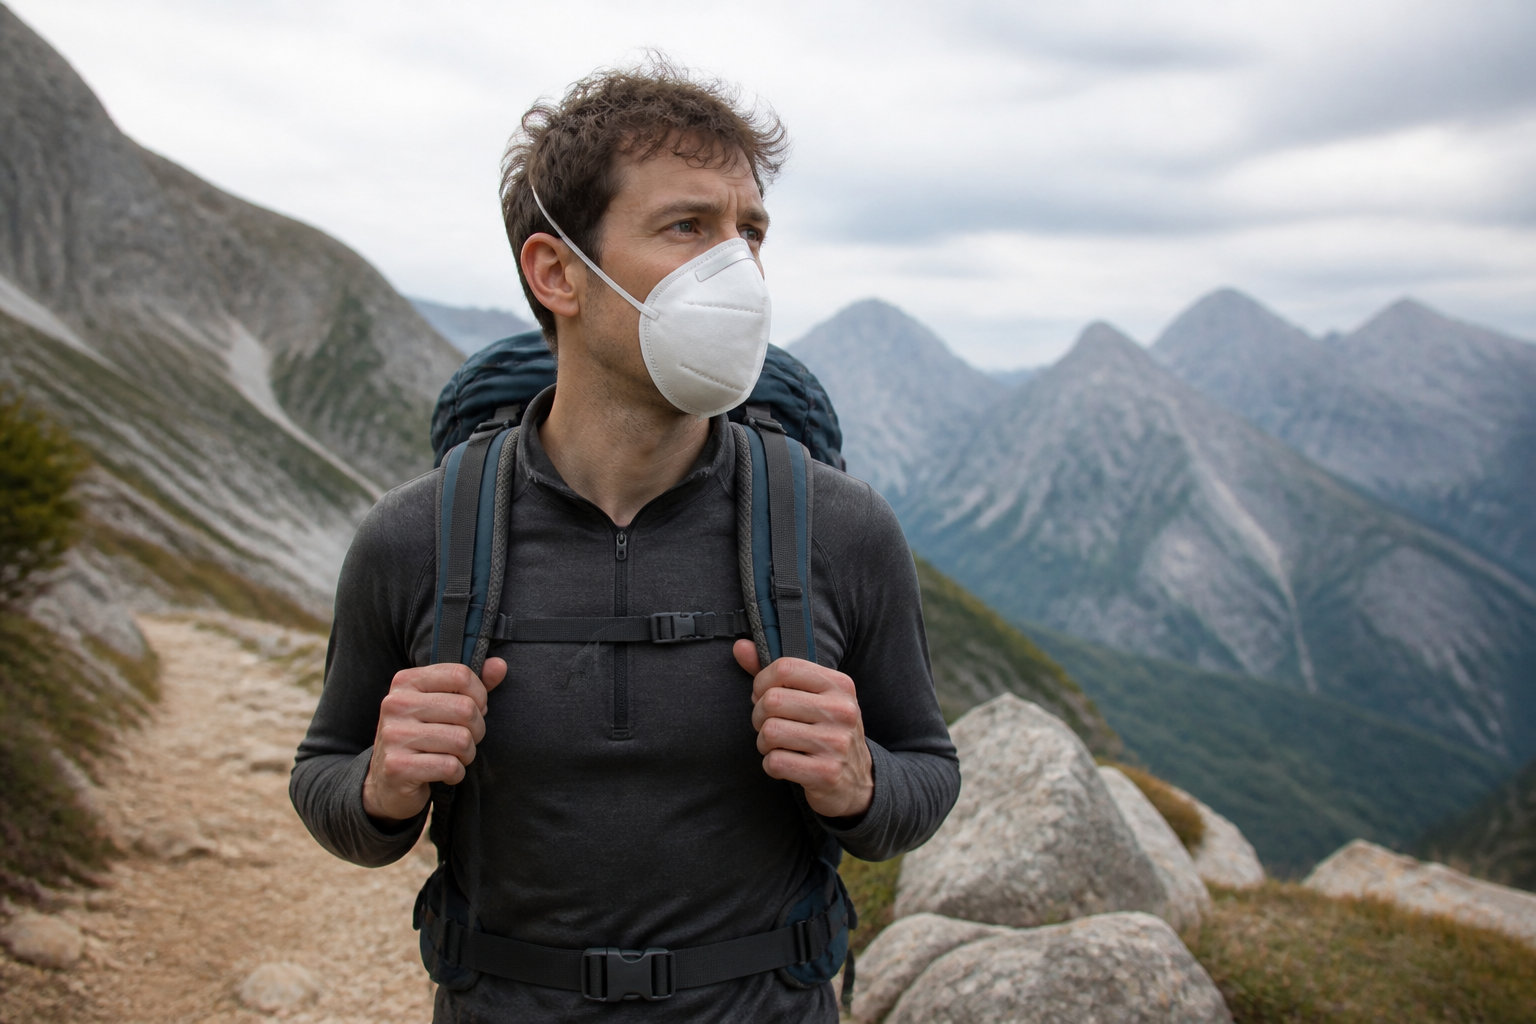
Smoke-heavy air is often extremely dry. Drink 500ml more water per hour than usual. This keeps mucous membranes moist during exposure.
Watch for coughing, chest tightness, or dizziness.
If you experience shortness of breath or persistent coughing, descend immediately and seek cleaner air at lower elevations.
Decision-Making Framework for Los Angeles Hikers
With the data and physiological risks understood, establishing a firm protocol for your outdoor plans is the final safety step.
The Go/No-Go Checklist Based on AQI Thresholds
Establish safety thresholds. Cancel hikes if AQI exceeds 100. Reroute to coastal areas if inland smoke plumes are visible on local maps.

Integrate Red Flag Warnings. These indicate high fire risk due to wind and heat. Use the following metrics for activity planning based on current air quality numbers.
| AQI Level | Risk Category | Hiker Recommendation |
|---|---|---|
| 0-50 | Safe | Ideal for all hikes |
| 51-100 | Moderate | Safe for most; sensitive groups rest |
| 101-150 | Sensitive Groups Beware | Choose easier trails; reduce pace |
| 151+ | Unhealthy for All | Cancel hike; move indoors |
Differentiate alerts. An air quality alert is a health warning. An evacuation warning means you must be ready to leave immediately.
Alternative Activities and Emergency Notification Setup
Suggest alternatives. Try coastal walks in the Malibu & Coast region. Sea breezes often keep these trails clearer than inland canyons.
Set up emergency alerts. Sign up for NotifyLA or local text notifications. Monitoring real-time conditions requires specific digital tools:
- AirNow app
- Watch Duty app
- Local emergency text codes
Identify mobile apps. Use PurpleAir for hyper-local sensor data while moving between different trail elevations.
Prioritize respiratory health by integrating real-time AQI tracking with active plume monitoring before every ascent. Utilizing a precise wildfire smoke map Los Angeles ensures you avoid dangerous PM2.5 concentrations and hazardous thermal inversions in canyons. Stay vigilant, adapt to shifting wind patterns, and never compromise your safety for a summit.
FAQ
How should I interpret the AQI color scale for hiking safety?
The Air Quality Index (AQI) operates on a 0-500 scale to categorize atmospheric pollution severity. A value of 0-50 (Green) indicates satisfactory conditions, while 101-150 (Orange) signals risks for sensitive groups, necessitating lighter exertion. Once the index exceeds 151 (Red), outdoor activities should be relocated indoors to avoid significant respiratory impact.
Why does wildfire smoke often concentrate in Los Angeles canyons?
Topographic features and thermal dynamics lead to smoke entrapment in low-lying areas. During early morning hours, thermal inversions trap cold, polluted air near the ground, while specific wind patterns like Santa Ana winds or valley breezes channel smoke through narrow passages. This creates hazardous micro-climates in locations such as Eaton or Runyon Canyon, even when coastal air remains clear.
What are the primary health risks of hiking in smoky conditions?
Physical exertion during steep climbs increases respiration rates, facilitating the deep penetration of PM2.5 fine particulates into the lungs and bloodstream. This exposure forces the heart to work harder and can cause throat irritation, reduced lung capacity, and dizziness. Hikers are advised to monitor for coughing or chest tightness and descend immediately if symptoms persist.
Does a standard face mask protect against wildfire smoke?
Standard surgical masks are ineffective at filtering PM2.5 particulates found in wildfire smoke. Protection requires a tightly sealed N95 respirator to successfully block fine ash and pollutants. Furthermore, because smoke-heavy air is typically dry, hikers must increase water intake by approximately 500ml per hour to maintain moist mucous membranes.
When should I cancel a planned hike due to air quality?
A “No-Go” decision should be reached if the AQI exceeds 100 or if local Red Flag Warnings are active, indicating high fire risk. Hikers should utilize real-time tools like the AirNow or Watch Duty apps to verify localized sensor data. If inland plumes are visible or alerts are issued, rerouting to the Malibu & Coast region is recommended, as onshore breezes often maintain superior air quality.